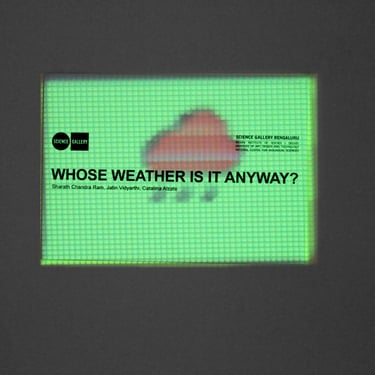
Whose weather is it, anyway?
Discussing data ecosystems with the public
Weather conditions mediate countless aspects of our lives — from tourism, holidays, food production, disasters, and even fluctuations in global stock markets. Yet access to climate and meteorological data — and control over how it's used — remains deeply unequal. Who owns this information, and who decides how it’s distributed?
Today, both local and global weather data operate within regimes of intellectual property that prioritize closed, proprietary systems. These systems obscure the sources and processes behind forecasts, concentrating control in a few institutions that influence climate discourse and environmental policy on a global scale.
Weather narratives are produced largely by organizations with the authority to interpret natural phenomena and distribute forecasts, leaving little room for public participation or transparency. In response, this project created the conditions to hold dialogues about access and power in weather data with the public.
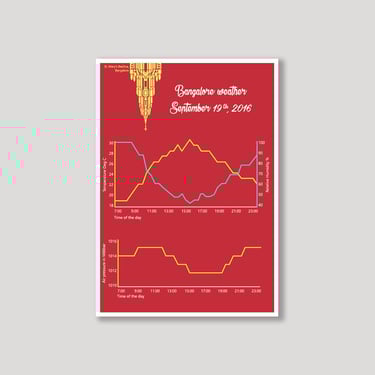
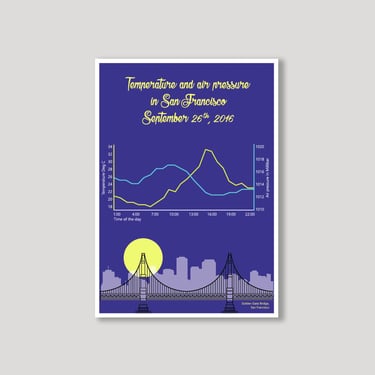
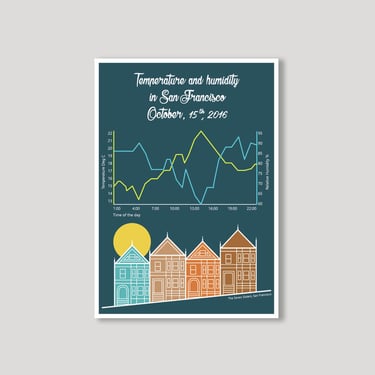
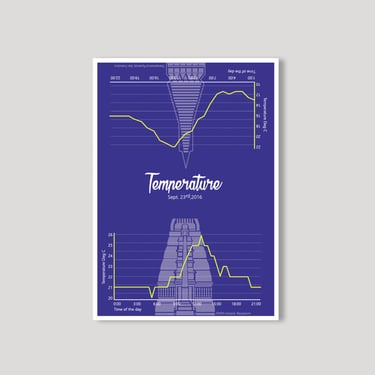
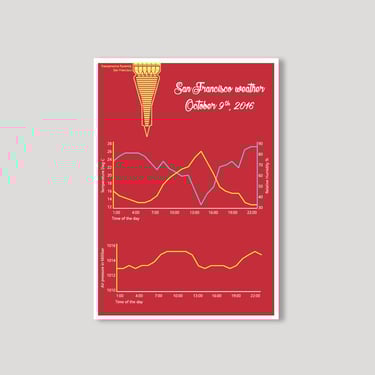
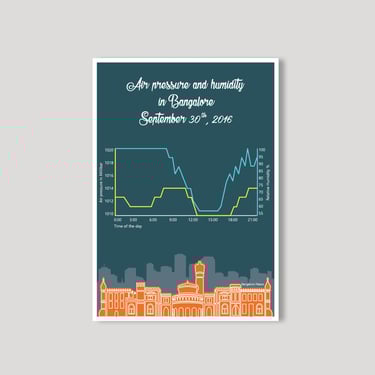
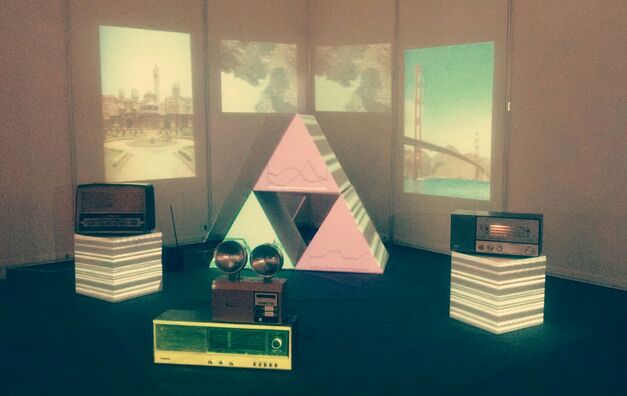
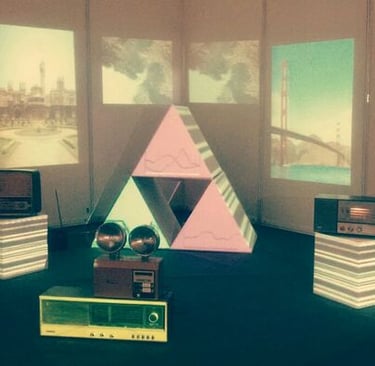
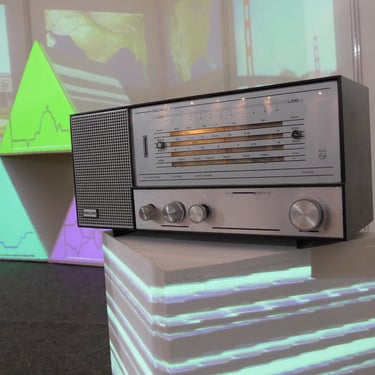
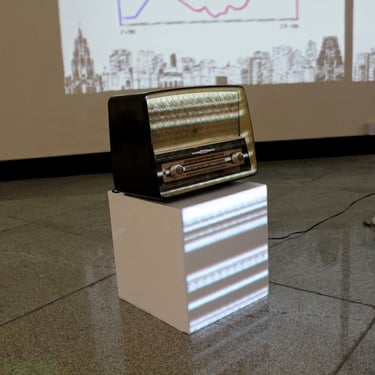
We scraped real-time weather data from airport sensors in Bangalore and its “sister city,” San Francisco, captured and decoded atmospheric variables such as temperature, pressure, and humidity. These datasets were then sonified and broadcast via FM radio, transforming raw data into a sound experience.
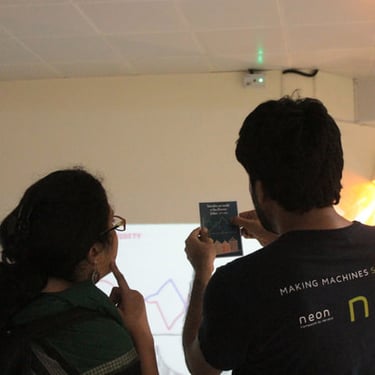
By combining this transmission with video, animation, and visual projections, we created an immersive, multi-sensory experience that invited the public to reflect on the politics of weather data. Through artistic practices and experimental interfaces, we exposed the often-invisible infrastructures of climate information.
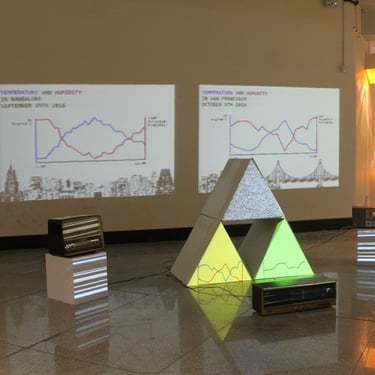
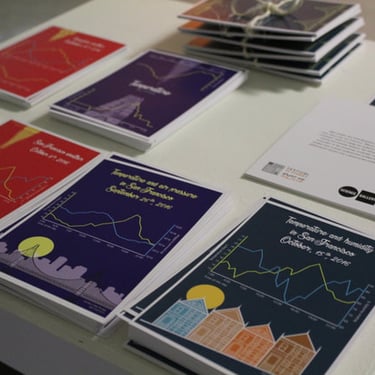
I designed a series of postcards that visually represent weather data from randomly selected dates in San Francisco and Bangalore. On the front, each postcard shows the data visualization; on the back, a QR code links to an audio file that sonifies the weather conditions from that specific day. This allowed viewers to follow the visual graphs while listening to the corresponding sonic interpretation of the data.
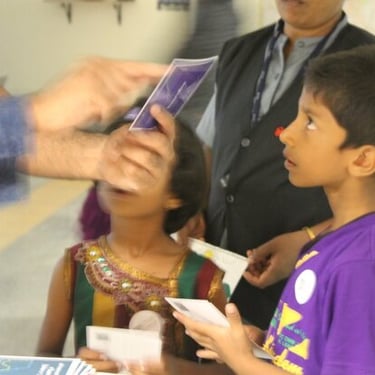
These postcards served as a powerful conversation-starter. By inviting people to recall or imagine the weather on a particular date — for example, “Do you remember the weather in Bangalore two days ago?” — the postcards encouraged a more personal, sensory connection to climate data. In doing so, they helped bridge abstract environmental information with everyday memory and embodied experience.