Graphic & Information Design
Systems thinking and infographics
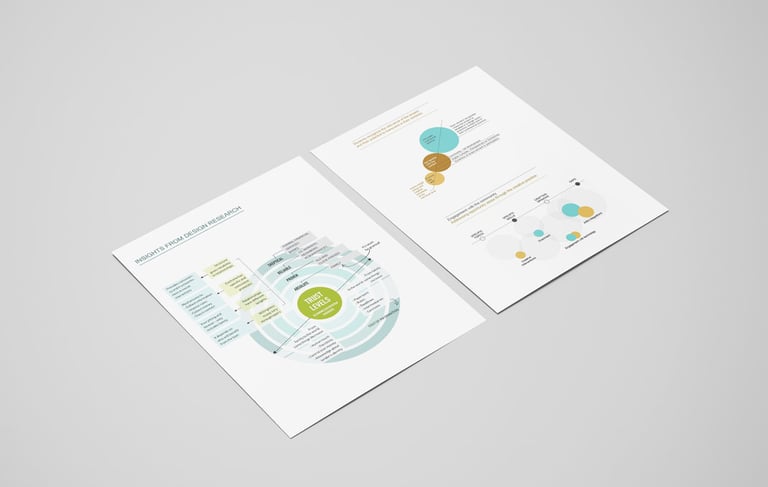
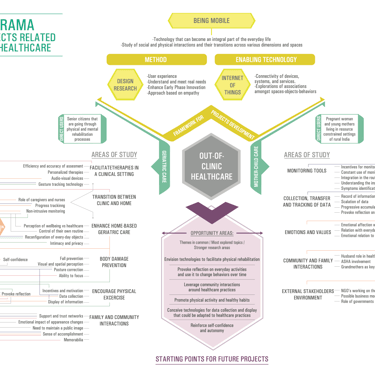
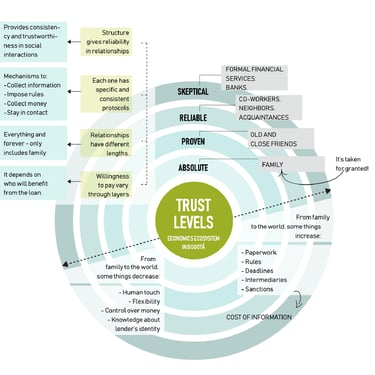
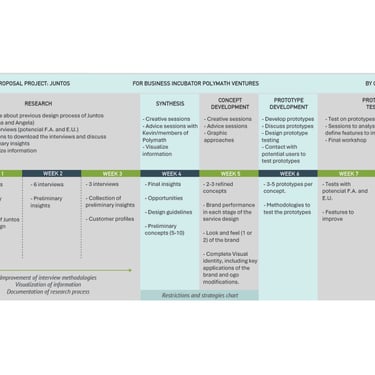
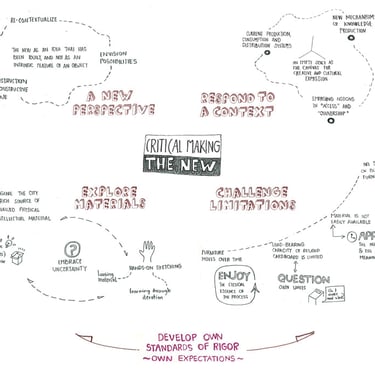
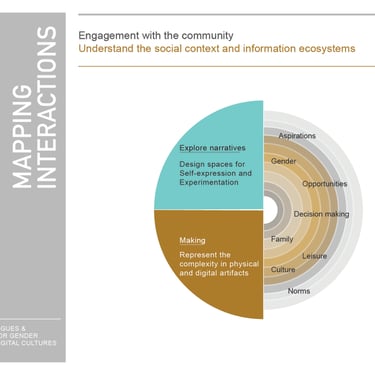
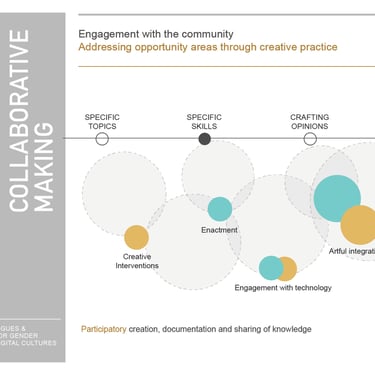
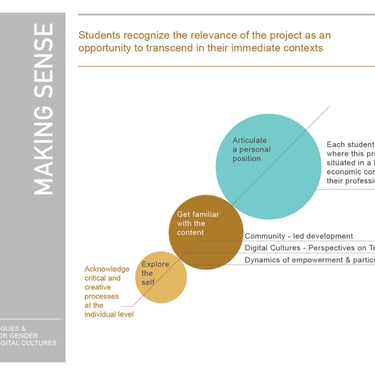
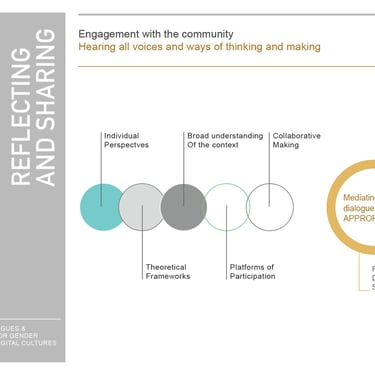
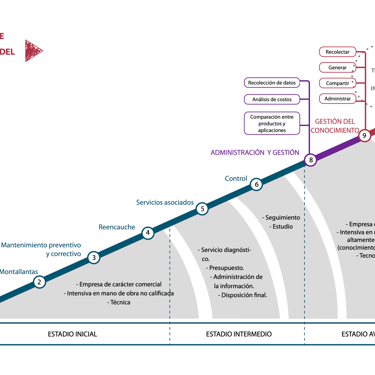
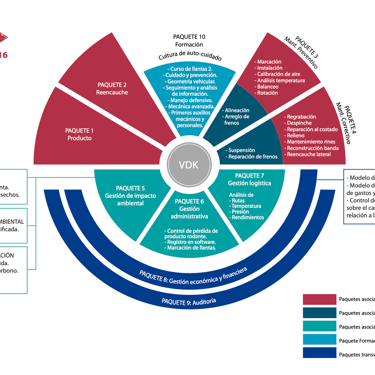
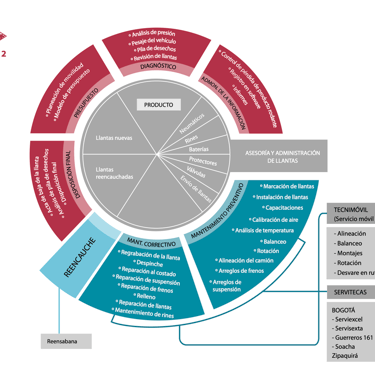
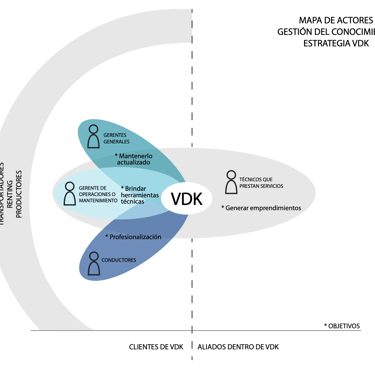
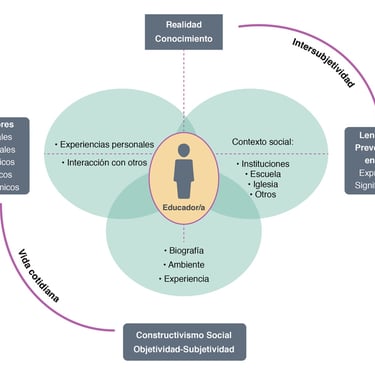
I've facilitated many visual thinking processes that lead teams to build shared understanding of concepts, topics, or design research.
This is a selection of visualizations conceived during project planning phases or produced for documentation purposes. Some of these were developed through discussions in working groups or design teams, capturing collective insights and ideas. They have been included in internal reports, educational materials, and diverse presentations, serving as valuable tools to illustrate processes, concepts, and findings.
Layout design and illustrations
Client: Prospera: International Network of Women´s funds
Project: Visualization of Report: 'Monitoring and Evaluating Theories of Change for Women’s Funds'.
Role: Converted organizational report into a publication, including layouts, infographic work and illustrations.
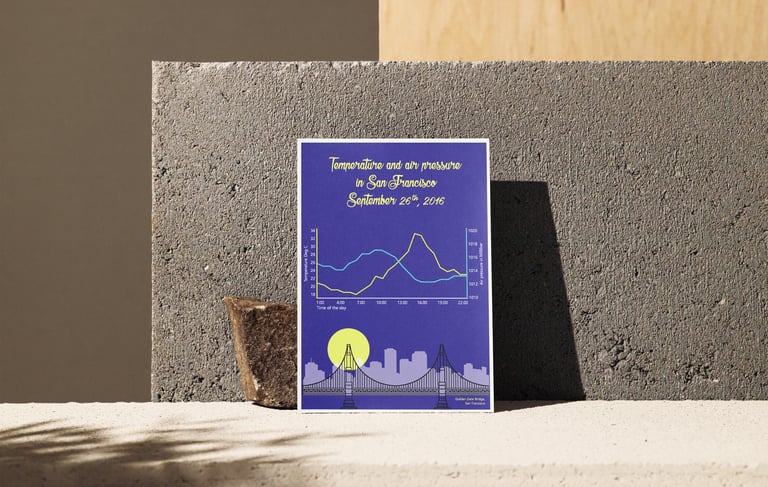
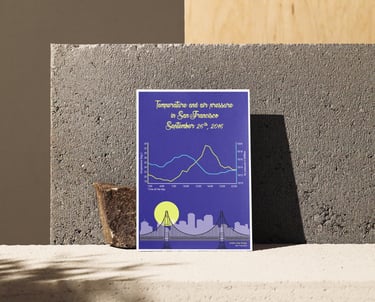
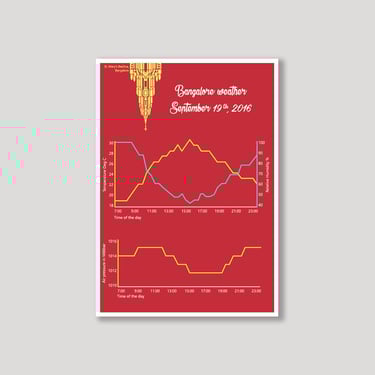
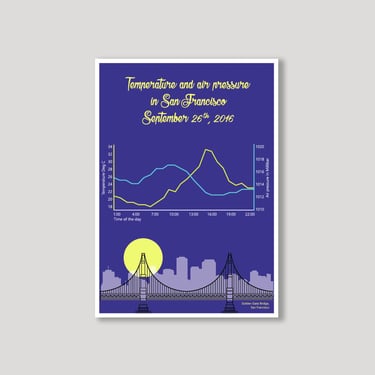
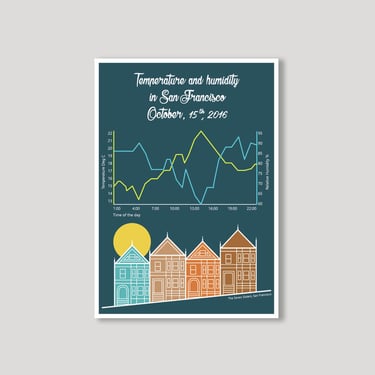
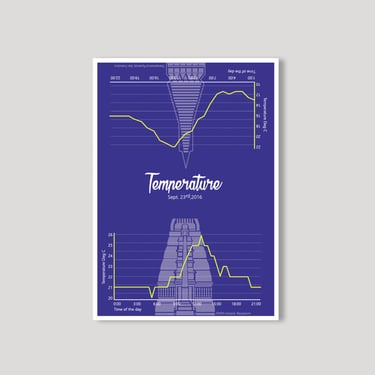
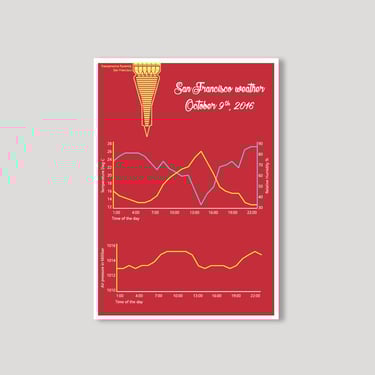
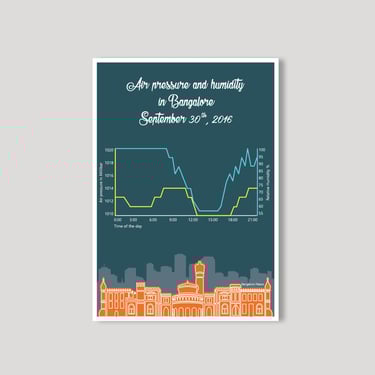
Data Visualization
These postcards use vector illustrations for data visualization. The postcards were a key touchpoint in the Art and Science Installation "Whose weather is it anyway"
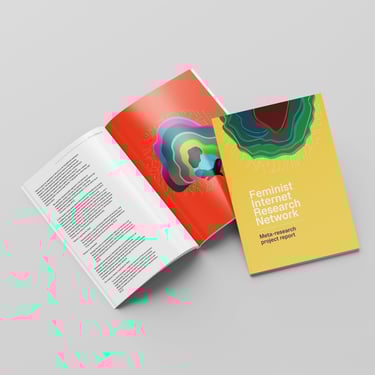
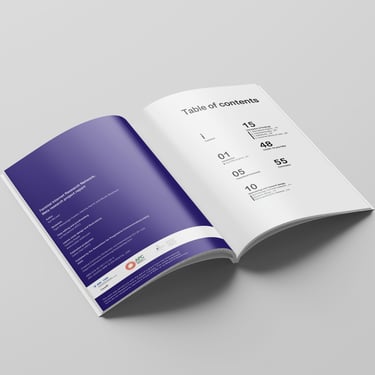
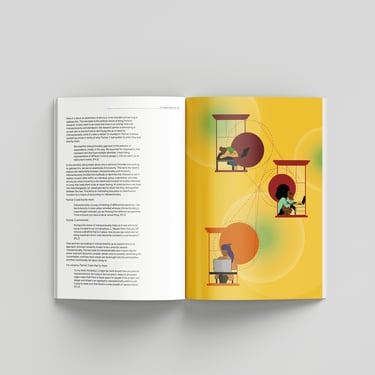
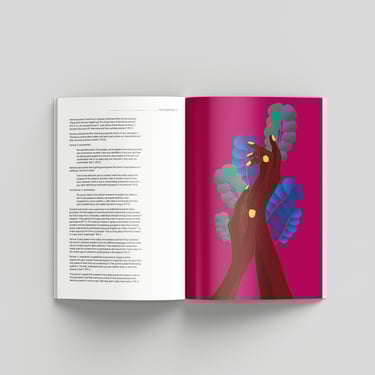
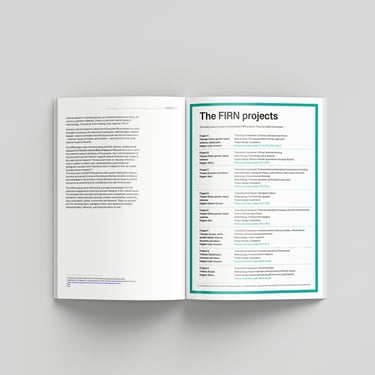
Publication Design
Client: The Feminist Internet Research Network
Role: Developed the layout design and created the illustrations for a Meta-Research Report.